Lucky 7?
The Probability of a Dice Roll
Probability is the likelihood of something happening or becoming. In this experiment, I looked for the probability of a number that will most likely occur when I roll 2 dice 100 times. I believed that the number 7 would be most probable due to a mathematical theory; the number 7 has a greater number of sum combinations than the others, so I believe that number 7 will have a higher probability of landing. For this experiment, I need 2 dice and a laptop to record the results after each roll. After completing the experiment, I created a bar graph and pie chart which shows that my results does not support my hypothesis. The number 8 occurred the most, despite having less sum combinations than the number 7. From this experiment, I have realized that probability is not completely accurate since there are factors that may alter the result.
Mitchell Lui
March 21, 2019
Rolling dice has been a source of entertainment since the early ages. People are always wondering what number they will need to roll in order to win or get what they want. For example, in monopoly, you always want to see what number you need in order to move to a certain spot and your chances of landing on that number. That is called probability, the likelihood of something occurring or becoming. On a single die, there are 6 sides, numbered 1-6, which means that there is a 1 out of 6 chance that it will land on a number between 1 and 6. On the other hand, when I roll two dice, there will be a total of 36 combinations, ranging from numbers 2-12. In this experiment, I will be rolling two dice 100 times and seeing what number has the highest probability. I believe that the number 7 will appear most frequently because out of every sum combination that can be found by rolling two dice, the number 7 has the most combinations.
Materials:
- Two Dice
- A Laptop
Method:
- Roll the dice.
- Record the data on an excel spreadsheet.
- Repeat steps 1 and 2 until you have rolled the dice 100 times.
- Create another excel spreadsheet to display the amount of times a number was landed on.
- Use the data recorded to create a graph and chart to display the results.
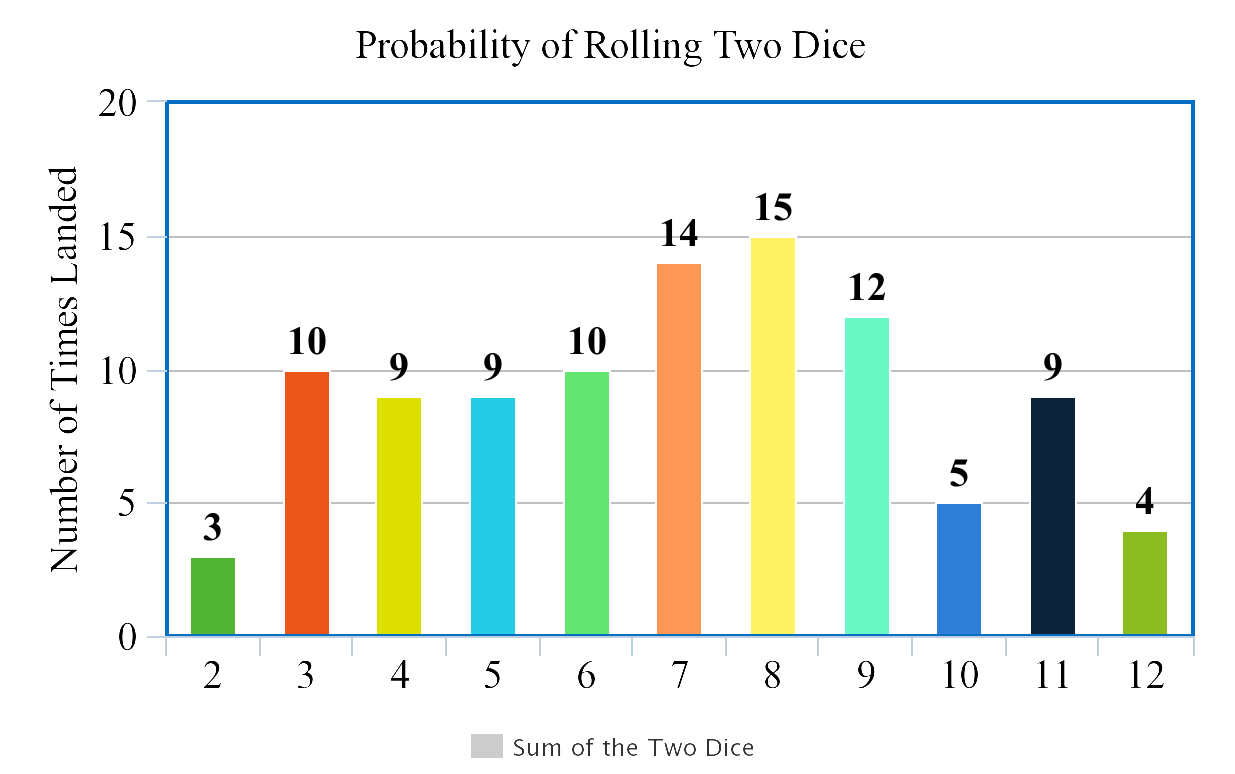
In the figure above, there is a bar graph that compares the number of times each number was landed on during the experiment of rolling two dice 100 times. As shown, the number 8 was landed the highest amount of times (15) , number 7 was landed the second highest amount of times (14) and the number 2 was landed the least amount of times (3).
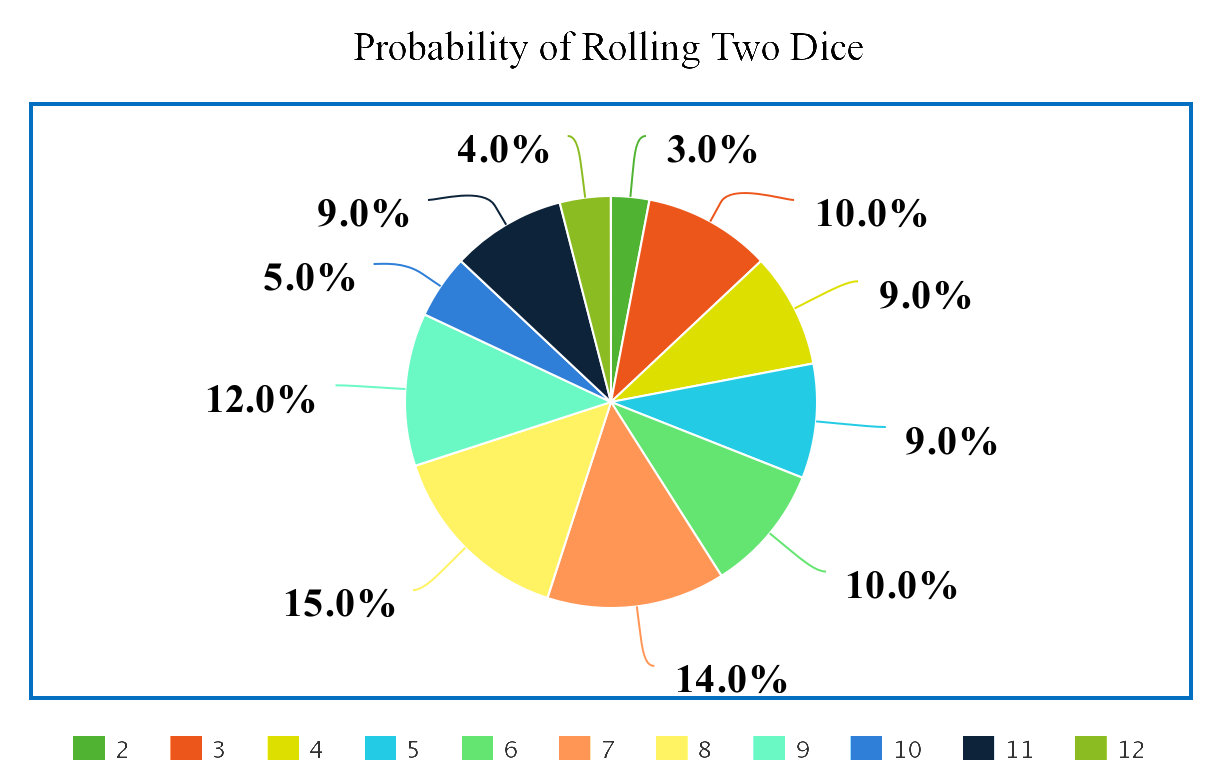
In the figure to the left, there is a pie chart that displays the difference in the percentage of every number from the two dice (2-12) throughout the 100 trials. As you can see, number 8 has the highest probability of being landed at 15.0%, number 7 has the second highest probability at 14% and the number 2 has the lowest probability of being landed at 3.0%.
After completing the experiment, it was shown that my hypothesis was incorrect; the number 7 was not the most probable. From my data, the number 8 was most probable (15 times), number 7 landed the second most (14 times) and number 2 landed the least (2 times). I believed that the number 7 was going to be most probable due to how mathematically, it has the most combinations given between the 2 dice, 6.
After completing the experiment, I researched and discovered a similar relationship between a 3 dice experiment to the 2 dice experiment. Number 10 in the 3 dice experiment is supposed to occur most frequently because it has the most possible combinations and numbers 9 and 11 are tied at the second most because they both have the second highest sum combinations. Throughout the 3 dice experiment, students rolled the dice 5,000 times and proved their hypothesis correctly (Lukac, S., & Engel, R.,2010). On their bar graph, there is a normal probability distribution, the number with the most sum combination is the highest and as you move away from the center, the probability decreases. As shown in my bar graph and pie chart, there is an abnormal probability distribution, the number with the highest sum combinations was not the most probable and other numbers such as 3, a number with low sum combinations landed a high amount of time.
In retrospect, number 7 is believed to have the highest probability because it has the most sum combinations and numbers 6 and 8 are second because they have the second most sum combinations. However, this is only a mathematical theory for the probability of dice rolling which can be affected by many factors. As shown through my experiment, the mathematical theory of the number with the highest sum combinations will be most probable is not completely valid. The number 8 occurred the most (15 times), whereas the number 7 occurred the second most (14 times). You can not base your reasoning on theories that can be affected by various variables.
Work Cited
Lukac, S., & Engel, R. (2010). Investigation of Probability Distributions Using Dice Rolling
Simulation. Retrieved from https://web-a-ebscohost-com.ccny-proxy1.libr.ccny.cuny.edu/ehost/pdfviewer/pdfviewer?vid=9&sid=27b5aa42-0aa5-44ac-a114-40edecef390f@sessionmgr4010
Appendix
| 1. 11 | 2. 5 | 3. 7 | 4. 7 | 5. 5 | 6. 7 | 7. 5 | 8. 9 | 9. 8 | 10. 11 |
| 11. 7 | 12. 9 | 13. 4 | 14. 5 | 15. 5 | 16. 3 | 17. 8 | 18. 2 | 19. 4 | 20. 7 |
| 21. 9 | 22. 8 | 23. 4 | 24. 7 | 25. 8 | 26. 3 | 27. 12 | 28. 8 | 29. 5 | 30. 9 |
| 31. 3 | 32. 10 | 33. 6 | 34. 10 | 35. 11 | 36. 9 | 37. 5 | 38. 11 | 39. 7 | 40. 11 |
| 41. 4 | 42. 4 | 43. 6 | 44. 12 | 45. 6 | 46. 10 | 47. 3 | 48. 6 | 49. 7 | 50. 4 |
| 51. 12 | 52. 9 | 53. 6 | 54. 2 | 55. 3 | 56. 8 | 57. 8 | 58. 3 | 59. 8 | 60. 8 |
| 61. 8 | 62. 11 | 63. 6 | 64. 6 | 65. 9 | 66. 4 | 67. 8 | 68. 11 | 69. 7 | 70. 6 |
| 71. 6 | 72. 3 | 73. 3 | 74. 9 | 75. 7 | 76. 8 | 77. 8 | 78. 7 | 79. 3 | 80. 7 |
| 81. 10 | 82. 11 | 83. 5 | 84. 9 | 85. 4 | 86. 9 | 87. 6 | 88. 12 | 89. 10 | 90. 9 |
| 91. 7 | 92. 3 | 93. 7 | 94. 9 | 95. 2 | 96. 8 | 97. 11 | 98. 5 | 99. 8 | 100. 4 |